|
chr12_-_54392328
|
4.278
|
NM_001144997
|
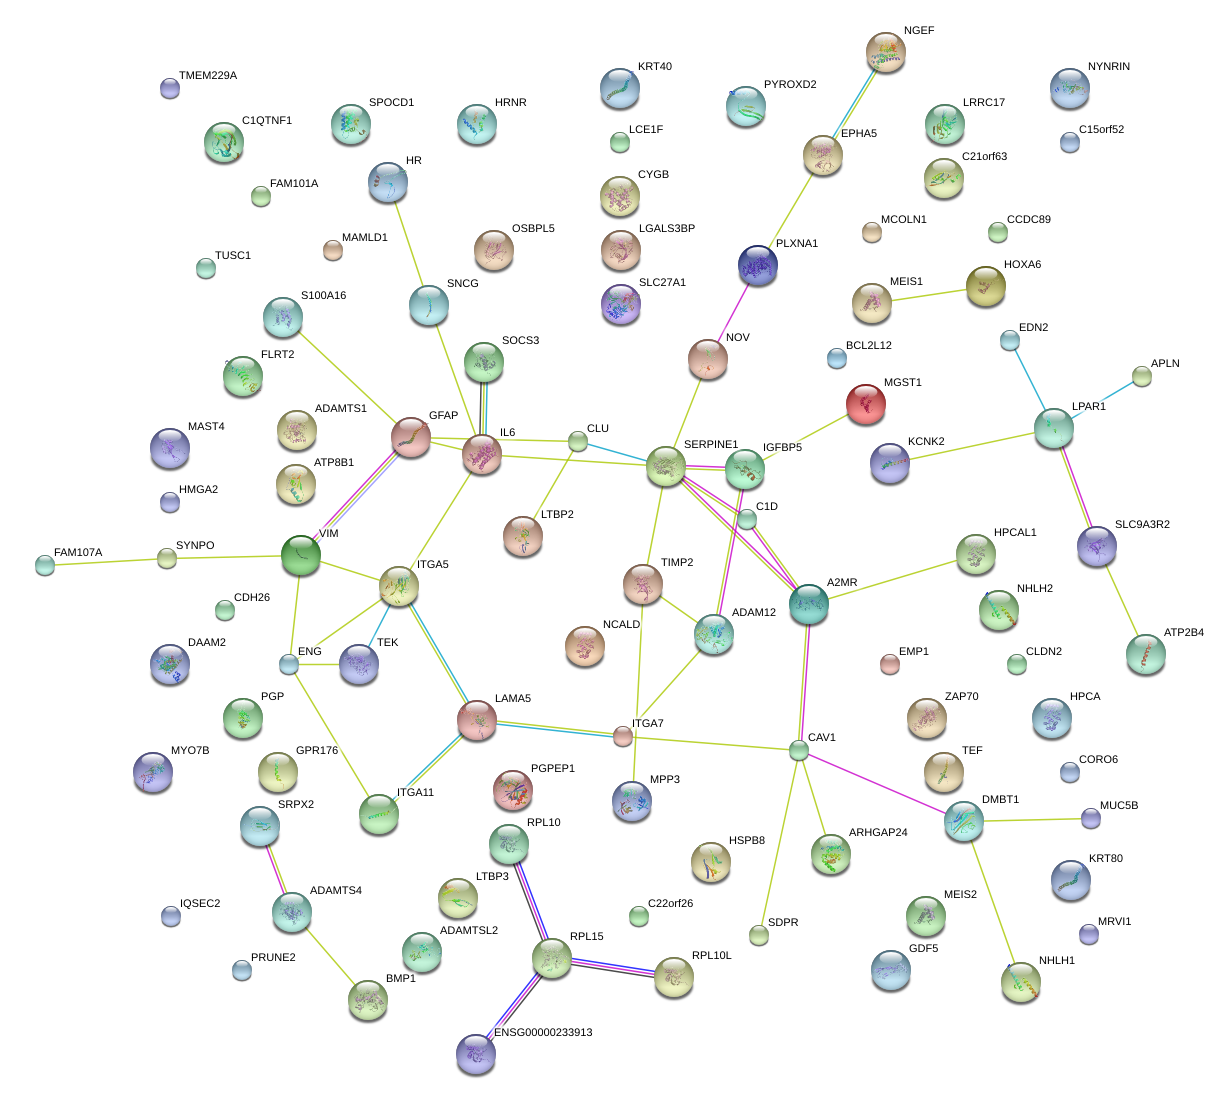
ITGA7
|
integrin, alpha 7
|
|
chr2_-_217268492
|
4.240
|
NM_000599
|
IGFBP5
|
insulin-like growth factor binding protein 5
|
|
chr12_+_13240868
|
3.334
|
NM_001423
|
EMP1
|
epithelial membrane protein 1
|
|
chr12_+_13240987
|
3.107
|
|
EMP1
|
epithelial membrane protein 1
|
|
chrX_-_128616594
|
2.957
|
NM_017413
|
APLN
|
apelin
|
|
chrX_-_53327473
|
2.827
|
NM_015075
|
IQSEC2
|
IQ motif and Sec7 domain 2
|
|
chr14_+_85066265
|
2.772
|
|
FLRT2
|
fibronectin leucine rich transmembrane protein 2
|
|
chr15_-_38417564
|
2.725
|
|
C15orf52
|
chromosome 15 open reading frame 52
|
|
chr14_+_85066207
|
2.644
|
NM_013231
|
FLRT2
|
fibronectin leucine rich transmembrane protein 2
|
|
chr15_-_38420414
|
2.611
|
NM_207380
|
C15orf52
|
chromosome 15 open reading frame 52
|
|
chr17_-_74487527
|
2.477
|
NM_005567
|
LGALS3BP
|
lectin, galactoside-binding, soluble, 3 binding protein
|
|
chr1_+_201862548
|
2.434
|
NM_001001396
NM_001684
|
ATP2B4
|
ATPase, Ca++ transporting, plasma membrane 4
|
|
chr11_-_3104413
|
2.414
|
|
OSBPL5
|
oxysterol binding protein-like 5
|
|
chr12_+_123339662
|
2.381
|
NM_181709
|
FAM101A
|
family with sequence similarity 101, member A
|
|
chr22_+_44828338
|
2.362
|
|
|
|
|
chr15_-_38000379
|
2.340
|
NM_007223
|
GPR176
|
G protein-coupled receptor 176
|
|
chr7_+_115952279
|
2.278
|
NM_001172895
|
CAV1
|
caveolin 1, caveolae protein, 22kDa
|
|
chr21_-_27139563
|
2.197
|
NM_006988
|
ADAMTS1
|
ADAM metallopeptidase with thrombospondin type 1 motif, 1
|
|
chr7_+_115952074
|
2.188
|
NM_001753
|
CAV1
|
caveolin 1, caveolae protein, 22kDa
|
|
chr12_+_55808514
|
2.170
|
NM_002332
|
LRP1
|
low density lipoprotein receptor-related protein 1
|
|
chr17_+_74542066
|
2.122
|
NM_198593
|
C1QTNF1
|
C1q and tumor necrosis factor related protein 1
|
|
chr17_-_24972471
|
2.016
|
NM_032854
|
CORO6
|
coronin 6
|
|
chr9_+_27099138
|
2.007
|
NM_000459
|
TEK
|
TEK tyrosine kinase, endothelial
|
|
chr17_-_74433048
|
1.976
|
NM_003255
|
TIMP2
|
TIMP metallopeptidase inhibitor 2
|
|
chr10_+_22580992
|
1.949
|
|
|
|
|
chr21_-_27139143
|
1.947
|
|
ADAMTS1
|
ADAM metallopeptidase with thrombospondin type 1 motif, 1
|
|
chr10_-_100164877
|
1.931
|
NM_032709
|
PYROXD2
|
pyridine nucleotide-disulphide oxidoreductase domain 2
|
|
chr20_-_33489383
|
1.900
|
NM_000557
|
GDF5
|
growth differentiation factor 5
|
|
chr5_+_150000394
|
1.884
|
NM_001109974
NM_007286
|
SYNPO
|
synaptopodin
|
|
chr8_+_22078817
|
1.846
|
|
BMP1
|
bone morphogenetic protein 1
|
|
chr7_+_22733290
|
1.827
|
NM_000600
|
IL6
|
interleukin 6 (interferon, beta 2)
|
|
chr7_-_123460722
|
1.822
|
NM_001136002
|
TMEM229A
|
transmembrane protein 229A
|
|
chr1_-_32036802
|
1.817
|
|
SPOCD1
|
SPOC domain containing 1
|
|
chr7_+_102340579
|
1.799
|
NM_001031692
NM_005824
|
LRRC17
|
leucine rich repeat containing 17
|
|
chr17_-_72045218
|
1.777
|
NM_134268
|
CYGB
|
cytoglobin
|
|
chr10_+_124310170
|
1.751
|
NM_004406
NM_007329
NM_017579
|
DMBT1
|
deleted in malignant brain tumors 1
|
|
chr8_+_22078622
|
1.711
|
|
BMP1
|
bone morphogenetic protein 1
|
|
chr8_+_22078589
|
1.706
|
NM_001199
NM_006129
|
BMP1
|
bone morphogenetic protein 1
|
|
chr17_-_36396778
|
1.706
|
NM_182497
|
KRT40
|
keratin 40
|
|
chr8_-_22044463
|
1.667
|
NM_005144
NM_018411
|
HR
|
hairless homolog (mouse)
|
|
chr22_+_40093245
|
1.665
|
NM_001145398
|
TEF
|
thyrotrophic embryonic factor
|
|
chr6_+_39868770
|
1.656
|
NM_015345
|
DAAM2
|
dishevelled associated activator of morphogenesis 2
|
|
chr2_-_233586145
|
1.627
|
|
NGEF
|
neuronal guanine nucleotide exchange factor
|
|
chr11_-_65082208
|
1.608
|
NM_001130144
NM_001164266
NM_021070
|
LTBP3
|
latent transforming growth factor beta binding protein 3
|
|
chr12_-_50871953
|
1.595
|
NM_001081492
NM_182507
|
KRT80
|
keratin 80
|
|
chr17_-_39265965
|
1.587
|
NM_001932
|
MPP3
|
membrane protein, palmitoylated 3 (MAGUK p55 subfamily member 3)
|
|
chr22_-_44828636
|
1.567
|
NM_018280
|
C22orf26
|
chromosome 22 open reading frame 26
|
|
chr11_-_10671736
|
1.543
|
|
MRVI1
|
murine retrovirus integration site 1 homolog
|
|
chr11_-_10672079
|
1.540
|
NM_001100163
NM_130385
|
MRVI1
|
murine retrovirus integration site 1 homolog
|
|
chr20_-_60360789
|
1.538
|
|
LAMA5
|
laminin, alpha 5
|
|
chrX_+_99785818
|
1.524
|
NM_014467
|
SRPX2
|
sushi-repeat containing protein, X-linked 2
|
|
chr2_+_97696462
|
1.494
|
NM_001079
|
ZAP70
|
zeta-chain (TCR) associated protein kinase 70kDa
|
|
chr1_+_201862845
|
1.494
|
|
ATP2B4
|
ATPase, Ca++ transporting, plasma membrane 4
|
|
chrX_+_106048245
|
1.492
|
NM_001171095
|
CLDN2
|
claudin 2
|
|
chr9_-_25668855
|
1.490
|
NM_001004125
|
TUSC1
|
tumor suppressor candidate 1
|
|
chr11_-_65082705
|
1.481
|
|
LTBP3
|
latent transforming growth factor beta binding protein 3
|
|
chr17_-_40348378
|
1.477
|
NM_001131019
NM_002055
|
GFAP
|
glial fibrillary acidic protein
|
|
chr21_+_32706615
|
1.473
|
NM_058187
|
C21orf63
|
chromosome 21 open reading frame 63
|
|
chr11_-_10671873
|
1.471
|
|
MRVI1
|
murine retrovirus integration site 1 homolog
|
|
chr10_+_88708267
|
1.466
|
NM_003087
|
SNCG
|
synuclein, gamma (breast cancer-specific protein 1)
|
|
chr9_-_78710698
|
1.455
|
NM_015225
|
PRUNE2
|
prune homolog 2 (Drosophila)
|
|
chr1_-_32054164
|
1.455
|
NM_144569
|
SPOCD1
|
SPOC domain containing 1
|
|
chr8_-_27525084
|
1.442
|
NM_001171138
|
CLU
|
clusterin
|
|
chr12_-_53099203
|
1.441
|
|
ITGA5
|
integrin, alpha 5 (fibronectin receptor, alpha polypeptide)
|
|
chr4_+_86968069
|
1.435
|
|
ARHGAP24
|
Rho GTPase activating protein 24
|
|
chr7_-_27153892
|
1.435
|
NM_024014
|
HOXA6
|
homeobox A6
|
|
chr1_-_159435440
|
1.431
|
NM_005099
|
ADAMTS4
|
ADAM metallopeptidase with thrombospondin type 1 motif, 4
|
|
chr1_-_151852128
|
1.407
|
NM_080388
|
S100A16
|
S100 calcium binding protein A16
|
|
chr4_-_66218777
|
1.386
|
|
EPHA5
|
EPH receptor A5
|
|
chr2_-_233586164
|
1.379
|
NM_019850
|
NGEF
|
neuronal guanine nucleotide exchange factor
|
|
chr11_-_85074848
|
1.369
|
NM_152723
|
CCDC89
|
coiled-coil domain containing 89
|
|
chr12_+_118100977
|
1.367
|
NM_014365
|
HSPB8
|
heat shock 22kDa protein 8
|
|
chr12_+_55808696
|
1.365
|
|
LRP1
|
low density lipoprotein receptor-related protein 1
|
|
chr9_-_129656778
|
1.311
|
|
ENG
|
endoglin
|
|
chr2_+_128009782
|
1.310
|
NM_001080527
|
MYO7B
|
myosin VIIB
|
|
chr20_+_58004811
|
1.308
|
NM_021810
|
CDH26
|
cadherin 26
|
|
chr1_-_32036858
|
1.298
|
|
SPOCD1
|
SPOC domain containing 1
|
|
chr3_-_58538110
|
1.281
|
|
FAM107A
|
family with sequence similarity 107, member A
|
|
chr19_+_7493436
|
1.280
|
NM_020533
|
MCOLN1
|
mucolipin 1
|
|
chr10_-_128067052
|
1.279
|
|
ADAM12
|
ADAM metallopeptidase domain 12
|
|
chr8_-_27524744
|
1.278
|
NM_203339
|
CLU
|
clusterin
|
|
chr16_-_2204776
|
1.253
|
NM_001042371
|
PGP
|
phosphoglycolate phosphatase
|
|
chr14_+_23937766
|
1.238
|
NM_025081
|
NYNRIN
|
NYN domain and retroviral integrase containing
|
|
chr12_+_64504408
|
1.218
|
NM_003483
NM_003484
|
HMGA2
|
high mobility group AT-hook 2
|
|
chr9_-_129656413
|
1.215
|
|
ENG
|
endoglin
|
|
chr10_+_17311242
|
1.201
|
|
VIM
|
vimentin
|
|
chr12_+_16397617
|
1.194
|
NM_145764
|
MGST1
|
microsomal glutathione S-transferase 1
|
|
chr2_+_66516196
|
1.188
|
|
MEIS1
|
Meis homeobox 1
|
|
chr19_+_17440577
|
1.186
|
|
SLC27A1
|
solute carrier family 27 (fatty acid transporter), member 1
|
|
chr8_+_120497732
|
1.185
|
NM_002514
|
NOV
|
nephroblastoma overexpressed gene
|
|
chr1_+_151015471
|
1.176
|
NM_178354
|
LCE1F
|
late cornified envelope 1F
|
|
chr10_-_17311961
|
1.174
|
|
|
|
|
chr2_+_66516020
|
1.170
|
NM_002398
|
MEIS1
|
Meis homeobox 1
|
|
chr9_-_129656581
|
1.170
|
|
ENG
|
endoglin
|
|
chr1_+_201862552
|
1.152
|
|
ATP2B4
|
ATPase, Ca++ transporting, plasma membrane 4
|
|
chr9_-_112840064
|
1.150
|
NM_001401
NM_057159
|
LPAR1
|
lysophosphatidic acid receptor 1
|
|
chr1_+_213245507
|
1.144
|
NM_001017424
|
KCNK2
|
potassium channel, subfamily K, member 2
|
|
chr12_-_53099269
|
1.137
|
|
ITGA5
|
integrin, alpha 5 (fibronectin receptor, alpha polypeptide)
|
|
chr10_+_17311283
|
1.130
|
|
VIM
|
vimentin
|
|
chr9_+_135389698
|
1.127
|
NM_014694
|
ADAMTSL2
|
ADAMTS-like 2
|
|
chr10_-_128067001
|
1.126
|
|
ADAM12
|
ADAM metallopeptidase domain 12
|
|
chrX_+_149364377
|
1.123
|
NM_001177466
NM_005491
|
MAMLD1
|
mastermind-like domain containing 1
|
|
chr7_+_22733626
|
1.120
|
|
IL6
|
interleukin 6 (interferon, beta 2)
|
|
chr9_-_25668230
|
1.113
|
|
TUSC1
|
tumor suppressor candidate 1
|
|
chr15_-_66511488
|
1.113
|
NM_001004439
|
ITGA11
|
integrin, alpha 11
|
|
chr7_+_115952325
|
1.112
|
|
CAV1
|
caveolin 1, caveolae protein, 22kDa
|
|
chr20_-_60375695
|
1.094
|
NM_005560
|
LAMA5
|
laminin, alpha 5
|
|
chr2_-_192419896
|
1.082
|
|
SDPR
|
serum deprivation response
|
|
chr10_+_17311307
|
1.081
|
|
VIM
|
vimentin
|
|
chr5_+_66160359
|
1.080
|
NM_015183
|
MAST4
|
microtubule associated serine/threonine kinase family member 4
|
|
chr11_+_1200894
|
1.077
|
|
MUC5B
|
mucin 5B, oligomeric mucus/gel-forming
|
|
chr2_+_10360471
|
1.075
|
NM_002149
|
HPCAL1
|
hippocalcin-like 1
|
|
chr17_-_73867748
|
1.072
|
NM_003955
|
SOCS3
|
suppressor of cytokine signaling 3
|
|
chr10_+_17311282
|
1.072
|
|
VIM
|
vimentin
|
|
chr18_-_53621277
|
1.070
|
NM_005603
|
ATP8B1
|
ATPase, aminophospholipid transporter, class I, type 8B, member 1
|
|
chr16_+_2025922
|
1.066
|
|
SLC9A3R2
|
solute carrier family 9 (sodium/hydrogen exchanger), member 3 regulator 2
|
|
chr10_+_17311347
|
1.055
|
|
VIM
|
vimentin
|
|
chr7_+_100557098
|
1.051
|
NM_000602
NM_001165413
|
SERPINE1
|
serpin peptidase inhibitor, clade E (nexin, plasminogen activator inhibitor type 1), member 1
|
|
chr1_+_116181927
|
1.050
|
|
NHLH2
|
nescient helix loop helix 2
|
|
chr1_-_41722883
|
1.049
|
NM_001956
|
EDN2
|
endothelin 2
|
|
chrX_+_99786044
|
1.046
|
|
SRPX2
|
sushi-repeat containing protein, X-linked 2
|
|
chr20_+_8997791
|
1.046
|
|
PLCB4
|
phospholipase C, beta 4
|
|
chr11_+_46679140
|
1.044
|
NM_001184751
|
ZNF408
|
zinc finger protein 408
|
|
chr2_-_216008689
|
1.039
|
|
FN1
|
fibronectin 1
|
|
chr7_-_81237162
|
1.036
|
NM_000601
NM_001010931
NM_001010932
NM_001010933
NM_001010934
|
HGF
|
hepatocyte growth factor (hepapoietin A; scatter factor)
|
|
chr11_-_6298284
|
1.035
|
NM_145040
|
PRKCDBP
|
protein kinase C, delta binding protein
|
|
chr9_-_35860316
|
1.029
|
NM_001004487
|
OR13J1
|
olfactory receptor, family 13, subfamily J, member 1
|
|
chr20_+_42007949
|
1.021
|
NM_001098798
|
TOX2
|
TOX high mobility group box family member 2
|
|
chr17_+_7402315
|
1.018
|
NM_001198622
NM_001198623
NM_001198624
NM_003808
NM_172087
NM_172088
|
TNFSF13
|
tumor necrosis factor (ligand) superfamily, member 13
|
|
chr10_+_102748062
|
1.016
|
|
LZTS2
|
leucine zipper, putative tumor suppressor 2
|
|
chr11_+_67532592
|
0.998
|
NM_001161473
|
ALDH3B1
|
aldehyde dehydrogenase 3 family, member B1
|
|
chr22_-_22970850
|
0.990
|
NM_001099781
NM_001099782
NM_004121
|
GGT5
|
gamma-glutamyltransferase 5
|
|
chr11_-_56846246
|
0.986
|
|
TNKS1BP1
|
tankyrase 1 binding protein 1, 182kDa
|
|
chr19_+_59941785
|
0.982
|
NM_015868
|
KIR2DS2
KIR2DL3
|
killer cell immunoglobulin-like receptor, two domains, short cytoplasmic tail, 2
killer cell immunoglobulin-like receptor, two domains, long cytoplasmic tail, 3
|
|
chr1_+_31659246
|
0.975
|
NM_001199039
NM_018565
|
SERINC2
|
serine incorporator 2
|
|
chr5_+_148941228
|
0.968
|
NM_001001669
|
ARHGEF37
|
Rho guanine nucleotide exchange factor (GEF) 37
|
|
chr11_+_12917369
|
0.961
|
|
TEAD1
|
TEA domain family member 1 (SV40 transcriptional enhancer factor)
|
|
chr15_-_88148538
|
0.958
|
|
ANPEP
|
alanyl (membrane) aminopeptidase
|
|
chr12_+_52618815
|
0.957
|
NM_017410
|
HOXC13
|
homeobox C13
|
|
chr1_-_6502655
|
0.953
|
NM_198681
|
PLEKHG5
|
pleckstrin homology domain containing, family G (with RhoGef domain) member 5
|
|
chr15_-_88148177
|
0.942
|
|
ANPEP
|
alanyl (membrane) aminopeptidase
|
|
chr2_-_192420168
|
0.938
|
NM_004657
|
SDPR
|
serum deprivation response
|
|
chrX_+_152423277
|
0.933
|
|
BGN
|
biglycan
|
|
chr1_-_171441234
|
0.922
|
|
TNFSF4
|
tumor necrosis factor (ligand) superfamily, member 4
|
|
chr15_-_88159061
|
0.918
|
NM_001150
|
ANPEP
|
alanyl (membrane) aminopeptidase
|
|
chr10_+_685887
|
0.915
|
|
C10orf108
|
chromosome 10 open reading frame 108
|
|
chr12_-_8271460
|
0.914
|
NM_018088
|
FAM90A1
|
family with sequence similarity 90, member A1
|
|
chr5_-_176763991
|
0.912
|
|
F12
|
coagulation factor XII (Hageman factor)
|
|
chr1_+_84539876
|
0.911
|
NM_001134663
|
SAMD13
|
sterile alpha motif domain containing 13
|
|
chr9_+_101623957
|
0.907
|
NM_006981
NM_173199
|
NR4A3
|
nuclear receptor subfamily 4, group A, member 3
|
|
chr7_+_142788730
|
0.907
|
|
ZYX
|
zyxin
|
|
chr7_+_142789476
|
0.907
|
|
ZYX
|
zyxin
|
|
chr19_-_1046373
|
0.903
|
|
POLR2E
|
polymerase (RNA) II (DNA directed) polypeptide E, 25kDa
|
|
chr10_-_49993425
|
0.903
|
NM_001031746
NM_144984
|
C10orf72
|
chromosome 10 open reading frame 72
|
|
chr2_-_218551786
|
0.894
|
|
TNS1
|
tensin 1
|
|
chr20_+_8997660
|
0.886
|
NM_001172646
|
PLCB4
|
phospholipase C, beta 4
|
|
chr10_-_128067062
|
0.885
|
NM_003474
NM_021641
|
ADAM12
|
ADAM metallopeptidase domain 12
|
|
chr21_+_45699830
|
0.883
|
NM_030582
NM_130444
|
COL18A1
|
collagen, type XVIII, alpha 1
|
|
chr16_+_620932
|
0.883
|
NM_053284
|
WFIKKN1
|
WAP, follistatin/kazal, immunoglobulin, kunitz and netrin domain containing 1
|
|
chr16_-_85099941
|
0.874
|
|
LOC400550
|
hypothetical LOC400550
|
|
chr3_+_127743868
|
0.869
|
|
CHST13
|
carbohydrate (chondroitin 4) sulfotransferase 13
|
|
chr17_+_7402788
|
0.869
|
|
TNFSF13
|
tumor necrosis factor (ligand) superfamily, member 13
|
|
chr5_+_38481392
|
0.867
|
NM_182801
|
EGFLAM
|
EGF-like, fibronectin type III and laminin G domains
|
|
chr12_-_53099277
|
0.864
|
NM_002205
|
ITGA5
|
integrin, alpha 5 (fibronectin receptor, alpha polypeptide)
|
|
chr19_-_1046316
|
0.861
|
|
POLR2E
|
polymerase (RNA) II (DNA directed) polypeptide E, 25kDa
|
|
chr3_+_42675841
|
0.855
|
|
ZBTB47
|
zinc finger and BTB domain containing 47
|
|
chr1_-_23683214
|
0.847
|
|
ASAP3
|
ArfGAP with SH3 domain, ankyrin repeat and PH domain 3
|
|
chr9_+_115396020
|
0.847
|
NM_144489
|
RGS3
|
regulator of G-protein signaling 3
|
|
chr19_+_40849554
|
0.845
|
NM_007000
|
UPK1A
|
uroplakin 1A
|
|
chr14_-_22515725
|
0.844
|
|
JUB
|
jub, ajuba homolog (Xenopus laevis)
|
|
chr5_-_16989371
|
0.842
|
NM_012334
|
MYO10
|
myosin X
|
|
chr19_-_12807221
|
0.837
|
NM_031429
|
RTBDN
|
retbindin
|
|
chr17_-_74432671
|
0.837
|
|
TIMP2
|
TIMP metallopeptidase inhibitor 2
|
|
chr7_-_44071640
|
0.813
|
NM_000290
|
PGAM2
|
phosphoglycerate mutase 2 (muscle)
|
|
chr16_-_19803606
|
0.813
|
NM_016235
|
GPRC5B
|
G protein-coupled receptor, family C, group 5, member B
|
|
chr1_+_107400789
|
0.812
|
NM_018137
|
PRMT6
|
protein arginine methyltransferase 6
|
|
chr8_+_144420939
|
0.809
|
NM_138465
|
GLI4
|
GLI family zinc finger 4
|
|
chr7_+_142723340
|
0.804
|
NM_000083
|
CLCN1
|
chloride channel 1, skeletal muscle
|
|
chr14_+_69021149
|
0.797
|
NM_001161498
|
UPF0639
|
UPF0639 protein
|
|
chr18_+_41558089
|
0.794
|
NM_001128588
NM_001146036
NM_015865
|
SLC14A1
|
solute carrier family 14 (urea transporter), member 1 (Kidd blood group)
|
|
chr7_-_5429702
|
0.792
|
NM_001080495
|
TNRC18
|
trinucleotide repeat containing 18
|
|
chr1_+_175407153
|
0.792
|
NM_021165
|
FAM5B
|
family with sequence similarity 5, member B
|
|
chr16_-_30032330
|
0.790
|
NM_024307
|
GDPD3
|
glycerophosphodiester phosphodiesterase domain containing 3
|
|
chr1_-_27089371
|
0.786
|
NM_018066
|
GPN2
|
GPN-loop GTPase 2
|
|
chr5_-_172130766
|
0.783
|
NM_004417
|
DUSP1
|
dual specificity phosphatase 1
|
|
chr8_+_144366442
|
0.783
|
NM_178172
|
GPIHBP1
|
glycosylphosphatidylinositol anchored high density lipoprotein binding protein 1
|
|
chr2_-_219404755
|
0.780
|
NM_017431
|
PRKAG3
|
protein kinase, AMP-activated, gamma 3 non-catalytic subunit
|
|
chr1_+_1836125
|
0.778
|
NM_138705
|
CALML6
|
calmodulin-like 6
|
|
chr9_-_129679760
|
0.776
|
NM_000476
|
AK1
|
adenylate kinase 1
|
|
chr10_-_128066935
|
0.775
|
|
ADAM12
|
ADAM metallopeptidase domain 12
|
|
chr3_+_171621721
|
0.769
|
NM_001185056
|
CLDN11
|
claudin 11
|
|
chr9_-_129656830
|
0.768
|
NM_000118
NM_001114753
|
ENG
|
endoglin
|
|
chr6_-_31853027
|
0.768
|
NM_025258
|
C6orf27
|
chromosome 6 open reading frame 27
|
|
chr16_+_31391998
|
0.762
|
NM_015927
|
TGFB1I1
|
transforming growth factor beta 1 induced transcript 1
|
|
chr1_-_171286634
|
0.758
|
NM_005092
|
TNFSF18
|
tumor necrosis factor (ligand) superfamily, member 18
|
|
chr20_+_19903778
|
0.742
|
|
RIN2
|
Ras and Rab interactor 2
|
|
chr9_-_23811808
|
0.741
|
|
ELAVL2
|
ELAV (embryonic lethal, abnormal vision, Drosophila)-like 2 (Hu antigen B)
|
|
chr6_-_47030492
|
0.741
|
NM_015234
|
GPR116
|
G protein-coupled receptor 116
|
|
chr5_+_176449156
|
0.739
|
NM_022963
|
FGFR4
|
fibroblast growth factor receptor 4
|
|
chr14_-_60260211
|
0.738
|
NM_017420
|
SIX4
|
SIX homeobox 4
|